This story wants to help who is given the task of breaking down a big application into microservices or to help who just want to have a better understanding of a complex Spring application.
Migrating an application to microservices means splitting the application and the database into isolated microservices and let them communicate through REST APIs and/or messages.
Here I am assuming that you are working with a large Spring application that exposes REST APIs and persists data in a database.
The first step is to understand how the APIs interact with the data.
When a REST API is called, how many database tables are affected?
It is not trivial to answer this question if you are dealing with a complex and large Monolith.
To try to answer that question, we can use a static call graph generator and then use a visualization library to display it.
I created a GitHub project that uses java-callgraph as static call graph generator and pyvis as visualization library to do that.
To see how it works, we will use a Spring Boot application called demo-customer. It exposes few REST APIs to manage customers and create simple reports.
Start by cloning the repo:
git clone https://github.com/marcello-dev/java-call-graph-plotter.git
Get into the project folder and then run:
java -jar javacg/javacg-0.1-SNAPSHOT-static.jar target-jar/demo-customer-0.0.1-SNAPSHOT.jar > call-graph.txt
We just created the call-graph.txt file of the demo-customer app.
To plot the graph we first need to install some Python dependencies:
# create a virual environment for Python 3
python3 -m venv venv
# Activate it
source venv/bin/activate
# Install the dependencies
pip install -r requirements.txt
Now you can plot the VisJs graph with:
python callgraphplotter.py call-graph.txt ApiDBSelector
A file called call-graph.html will be generated in the output folder. Open it in the browser and you should see this result:

This is the graph of the mapping between the REST APIs and the database in the demo-customer application.
The orange nodes represent the REST APIs in the CustomerController class and the blue nodes are the REST APIs in the ReportController class. The grey nodes represent the two database tables. CustomerRepository and ReportRepository are actually Java interfaces that let us save and query @Entity classes. However, in most cases there is a one-to-one mapping between the Repository interface and the database table.
Finally, the “arrows” represent database READ operations (in green) or WRITE operations (in red). If you hover the mouse on one arrow you can see the actual operation name! ;)
By looking at the graph we can immediately understand how the APIs interacts with the database without reading a line of code.
Identify the breaking points in the Monolith
We can see that the APIs in CustomerController use the CustomerRepository and the APIs in ReportController use the ReportRepository. However, the ReportController:generateReport API affects both tables. In fact, if we look at the code, it first counts the number of customers (READ operation) and then saves a new Report object in the database (WRITE operation).

In a microservice approach we want each microservice to manage its own data and expose it through proper APIs. So let’s assume we don’t want the Report APIs to access the Customer data directly.
In that case we decide to divide the application into two microservices: Customer and Report. The Report microservice will generate a report using a new API (provided by the Customer microservice) to get the total number of customers. In the figure you can see the new design:
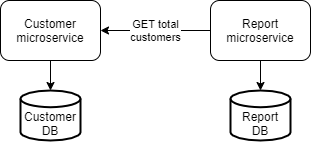
Obviously, this is just an example and there is no need to split such a small application. But if you are working with a large Monolith, visualizing how the APIs affect the data will help you with the design.
How to use it for your Spring application
The configuration requires a little bit of Python knowledge.
Short story:
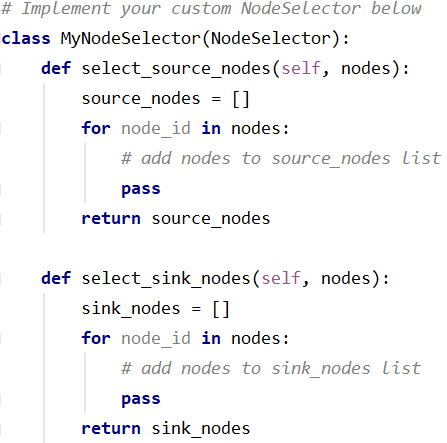
You need to implement this class in the file nodeselectors.py
Then generate your call-graph.txt with:
java -jar javacg/javacg-0.1-SNAPSHOT-static.jar my.jar > my-call-graph.txt
And run:
python callgraphplotter.py my-call-graph.txt MyNodeSelector
Note: the second argument (MyNodeSelector) must match the name of the class you implemented before.
And finally open the generated graph output/my-call-graph.html in your browser.
Long story:
The script callgraphplotter.py executes the following steps:
- Read the call-graph.txt file passed as argument
- Create a Networkx directed graph of all the method calls
- Select the relevant nodes to display
- Build a Visjs directed graph with the selected nodes in the previous step
- Plot the graph
Why we create two graphs? Because Visjs does not support graph operations out-of-the-box, so we need Networkx.
Additionally, the Networkx directed graph contains too many nodes (the simple demo-customer has >600 nodes!). So we need to select only the important nodes.
There are two types of relevant nodes: source and sink nodes.
In the demo-customer example the source nodes correspond to the methods in the @RestController classes, which are triggered when we receive an API call (e.g. CustomerController.saveCustomer). While the sink nodes correspond to the Repository classes which contain methods to READ/WRITE the database.
This is how to select the source and sink nodes for the demo-customer application:

The input of each method is the list of all the node IDs in the Networkx graph. The node ID is a string with the format: package.classname:methodname. Basically, the functions select_sink_nodes and select_sink_nodes return the list of nodes that will be displayed in the final graph.
To customize it for your Spring application you can simply implement the class MyNodeSelector (or create a new one) with your logic.
Then create the call graph from your jar file and run the callgraphplotter.py script as described in the Short Story.
Conclusions
With this story I shared how to visualize the internal method call relations in a Spring application and how you may use it to migrate to microservices.
However this approach is not limited to visualize the API-database relations, it can be used to show any type of relations in the call graph. For example, I also used it to display the relations between the APIs and the REST calls to other microservices.
Thank you for reading! If you found it useful star my GitHub repo and feel free to fork it or submit any issue.